Explore your data with Scanner and Studies
This guide assumes your database is filling. Getting Started and Sync Data cover that.
Scanner and Studies are paid plugins, free for the first month. Install each from the Store: open the Store tab, then Browse, select the bundle, and click Subscribe, then Install.
Scanner
Scanner is for quick lookups: one saved SQL query over any table in the analytics database, with the rows of the last run shown as a table. You don't write the scan yourself. Ask the in-app agent, and it picks the tables, joins them, chooses the columns and sets a row limit. Each scan is saved under its own name, and you can rerun it from the Scanner panel or by asking the agent.
Studies
Studies is for data visualization and for complex work that needs a multi-stage pipeline. The agent builds a study in two layers:
- Models: named SQL queries that can build on tables and on each other, so one model can feed the next. Each is checked against the database before it's saved. A model that is slow to compute can be stored as a table and refreshed when its data changes.
- The study: linked charts and inputs that read only from models. Each chart's aggregation runs inside DuckDB. Selecting or brushing in one chart cross-filters the others, and selections and input values are saved with the study.
Example: from scan to study
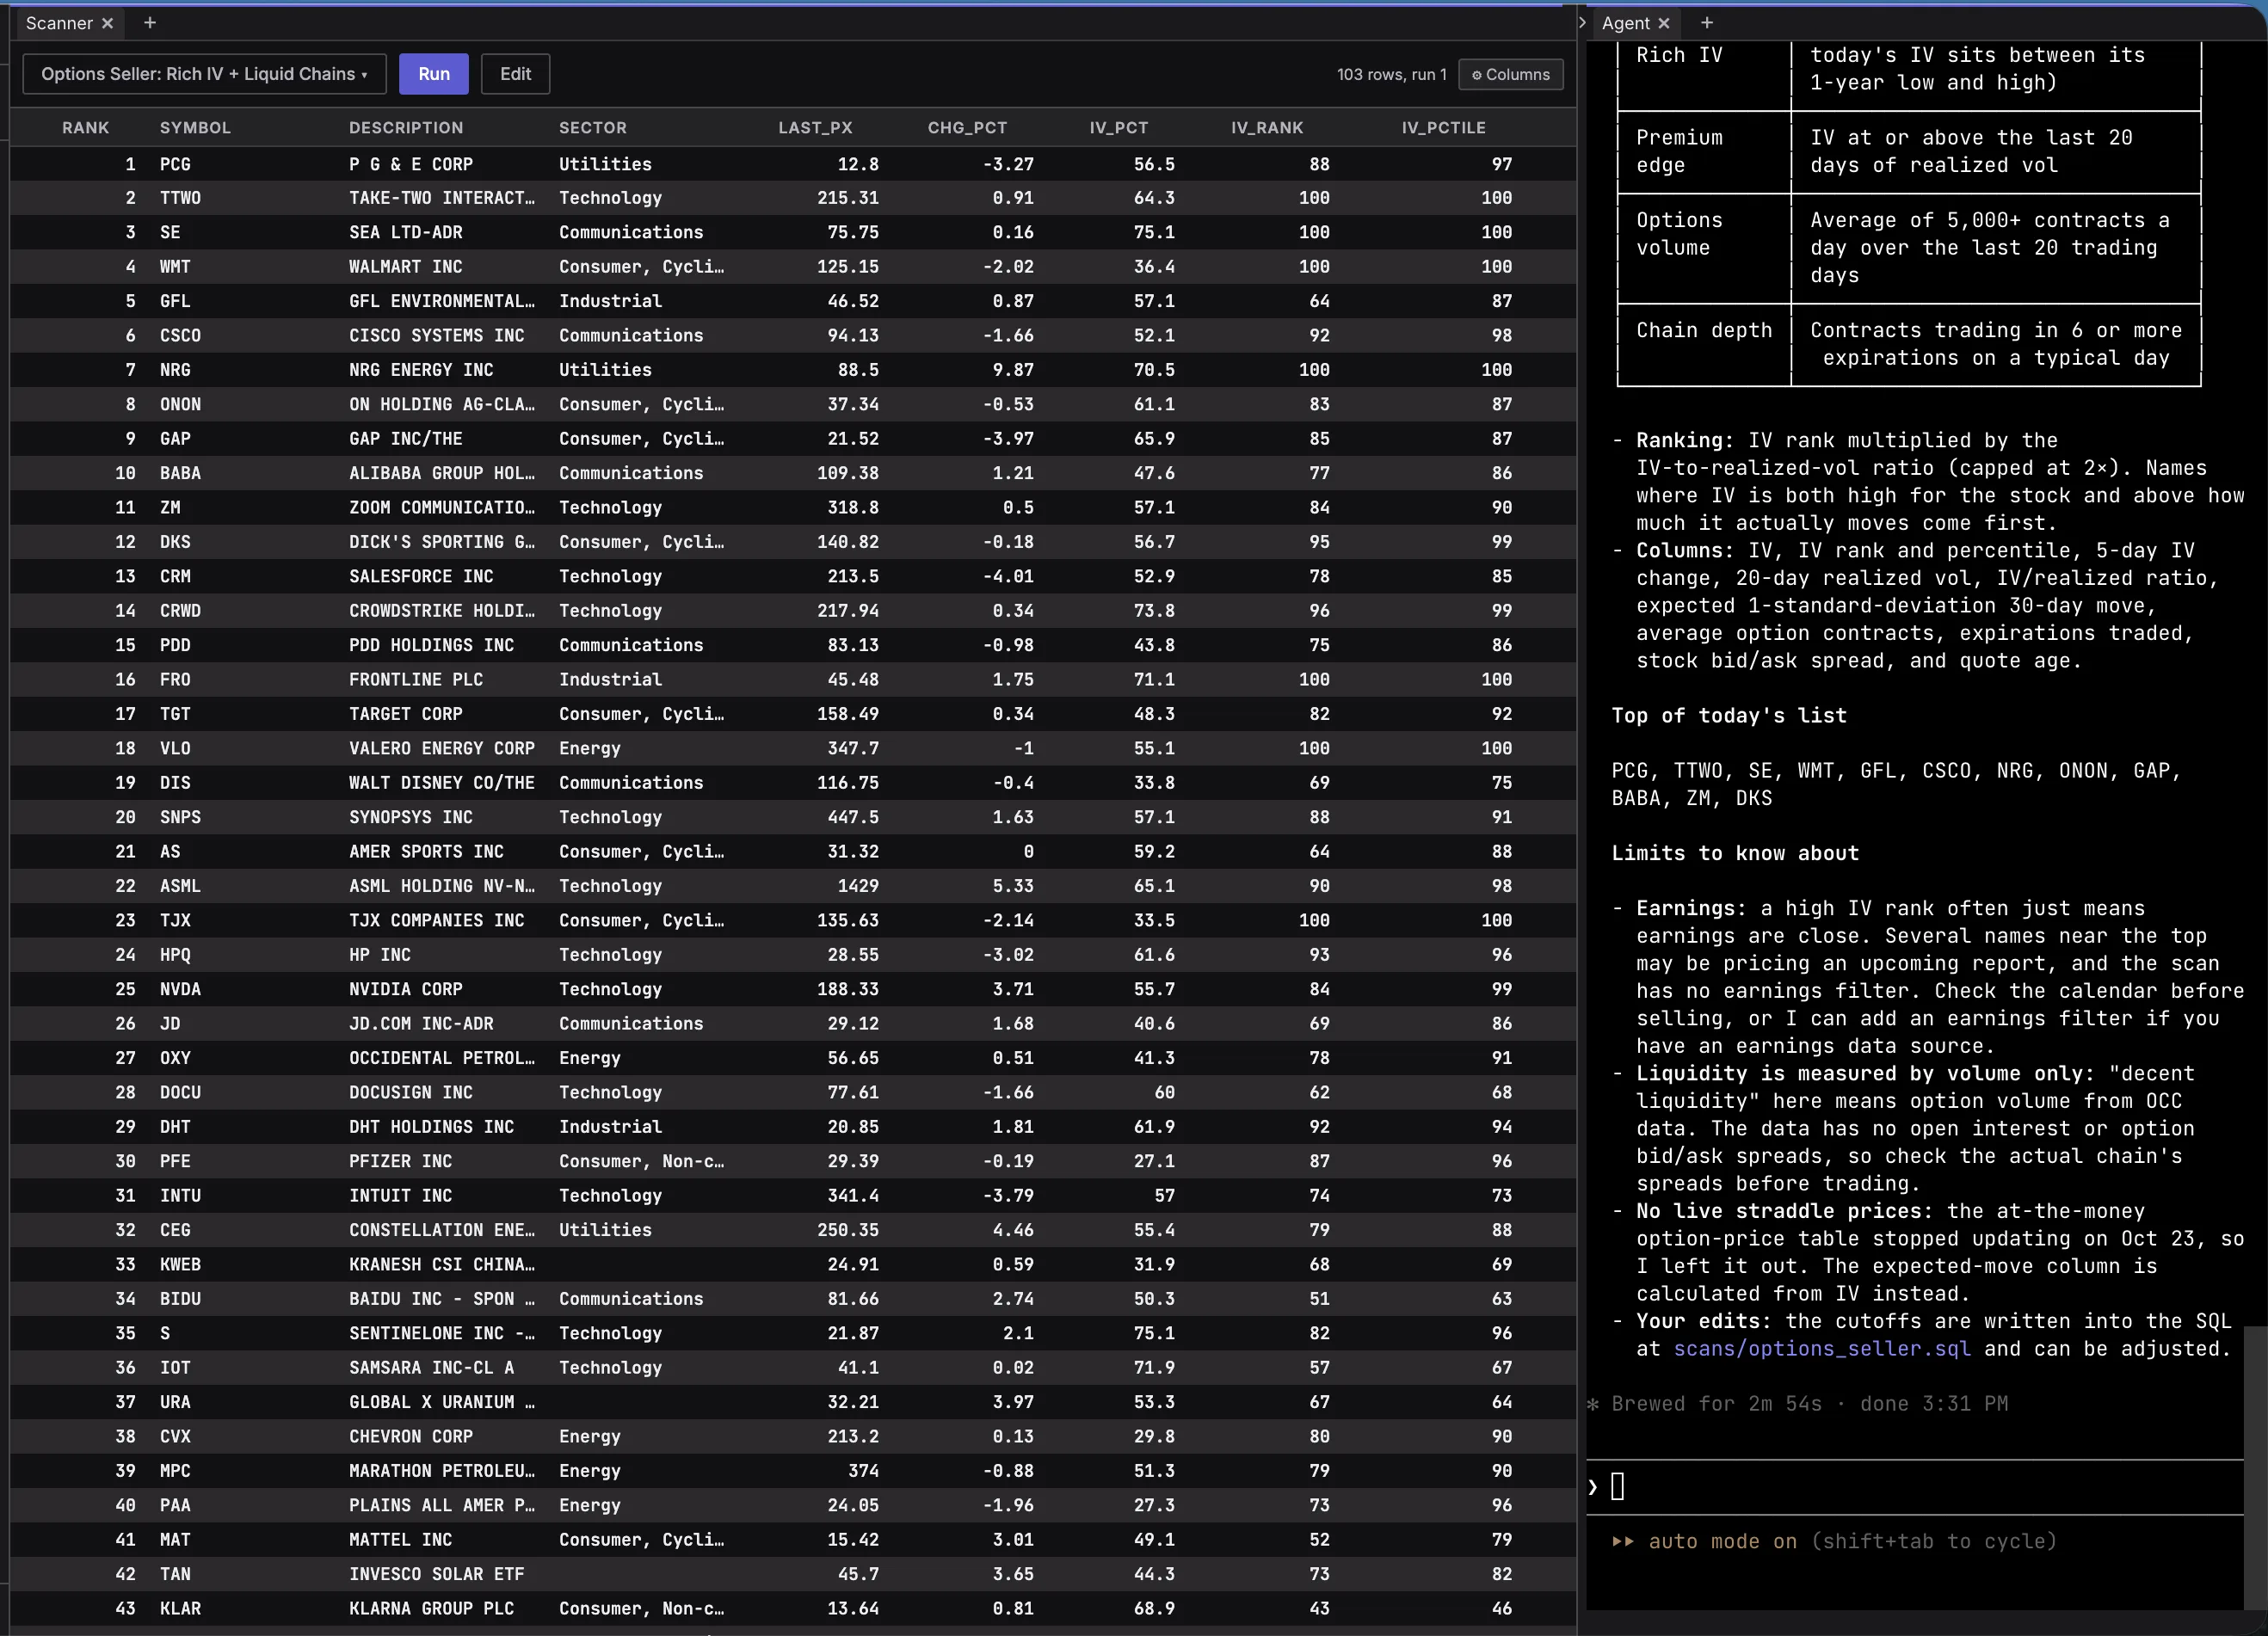
Make a new scanner for options sellers that finds stocks with reasonable IV and decent options liquidity.
The agent finds the tables that carry implied volatility and options volume, writes the scan, checks its results, and saves it. The scan appears in the Scanner panel, and the agent explains its filters, ranking, and limits.
Great. Now I want a bit more insight: a study of VRP vs. RV percentile.
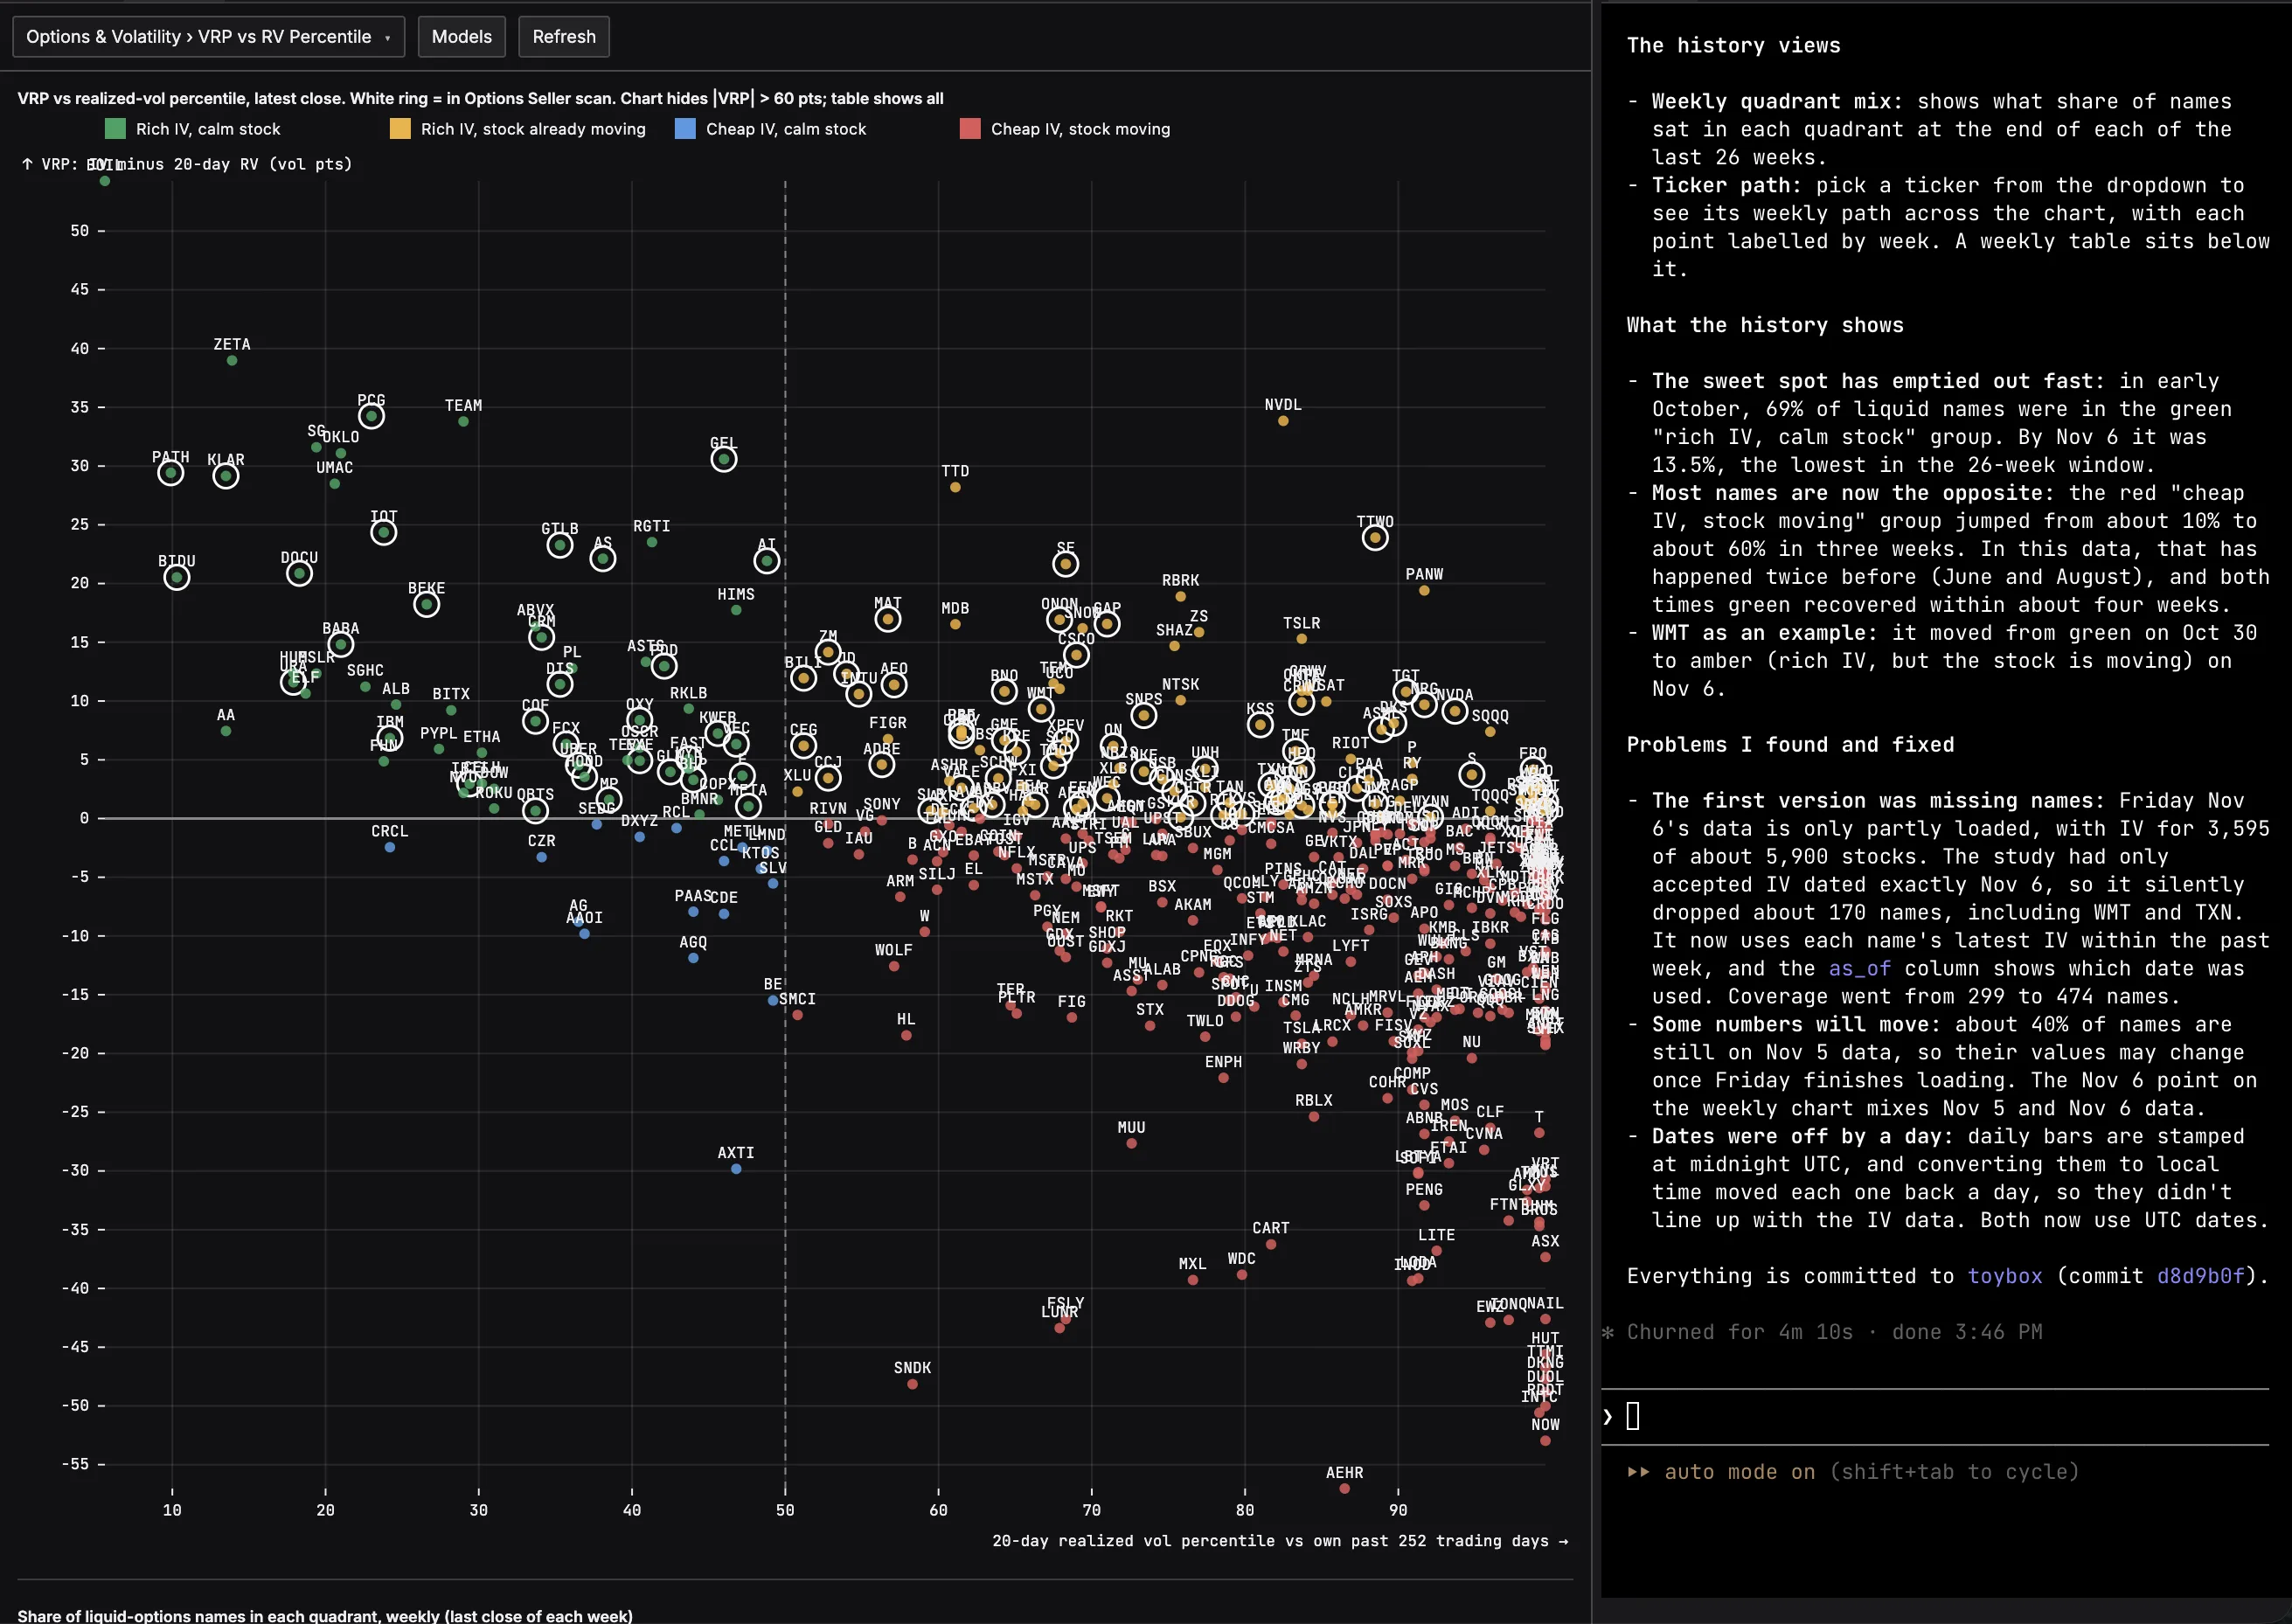
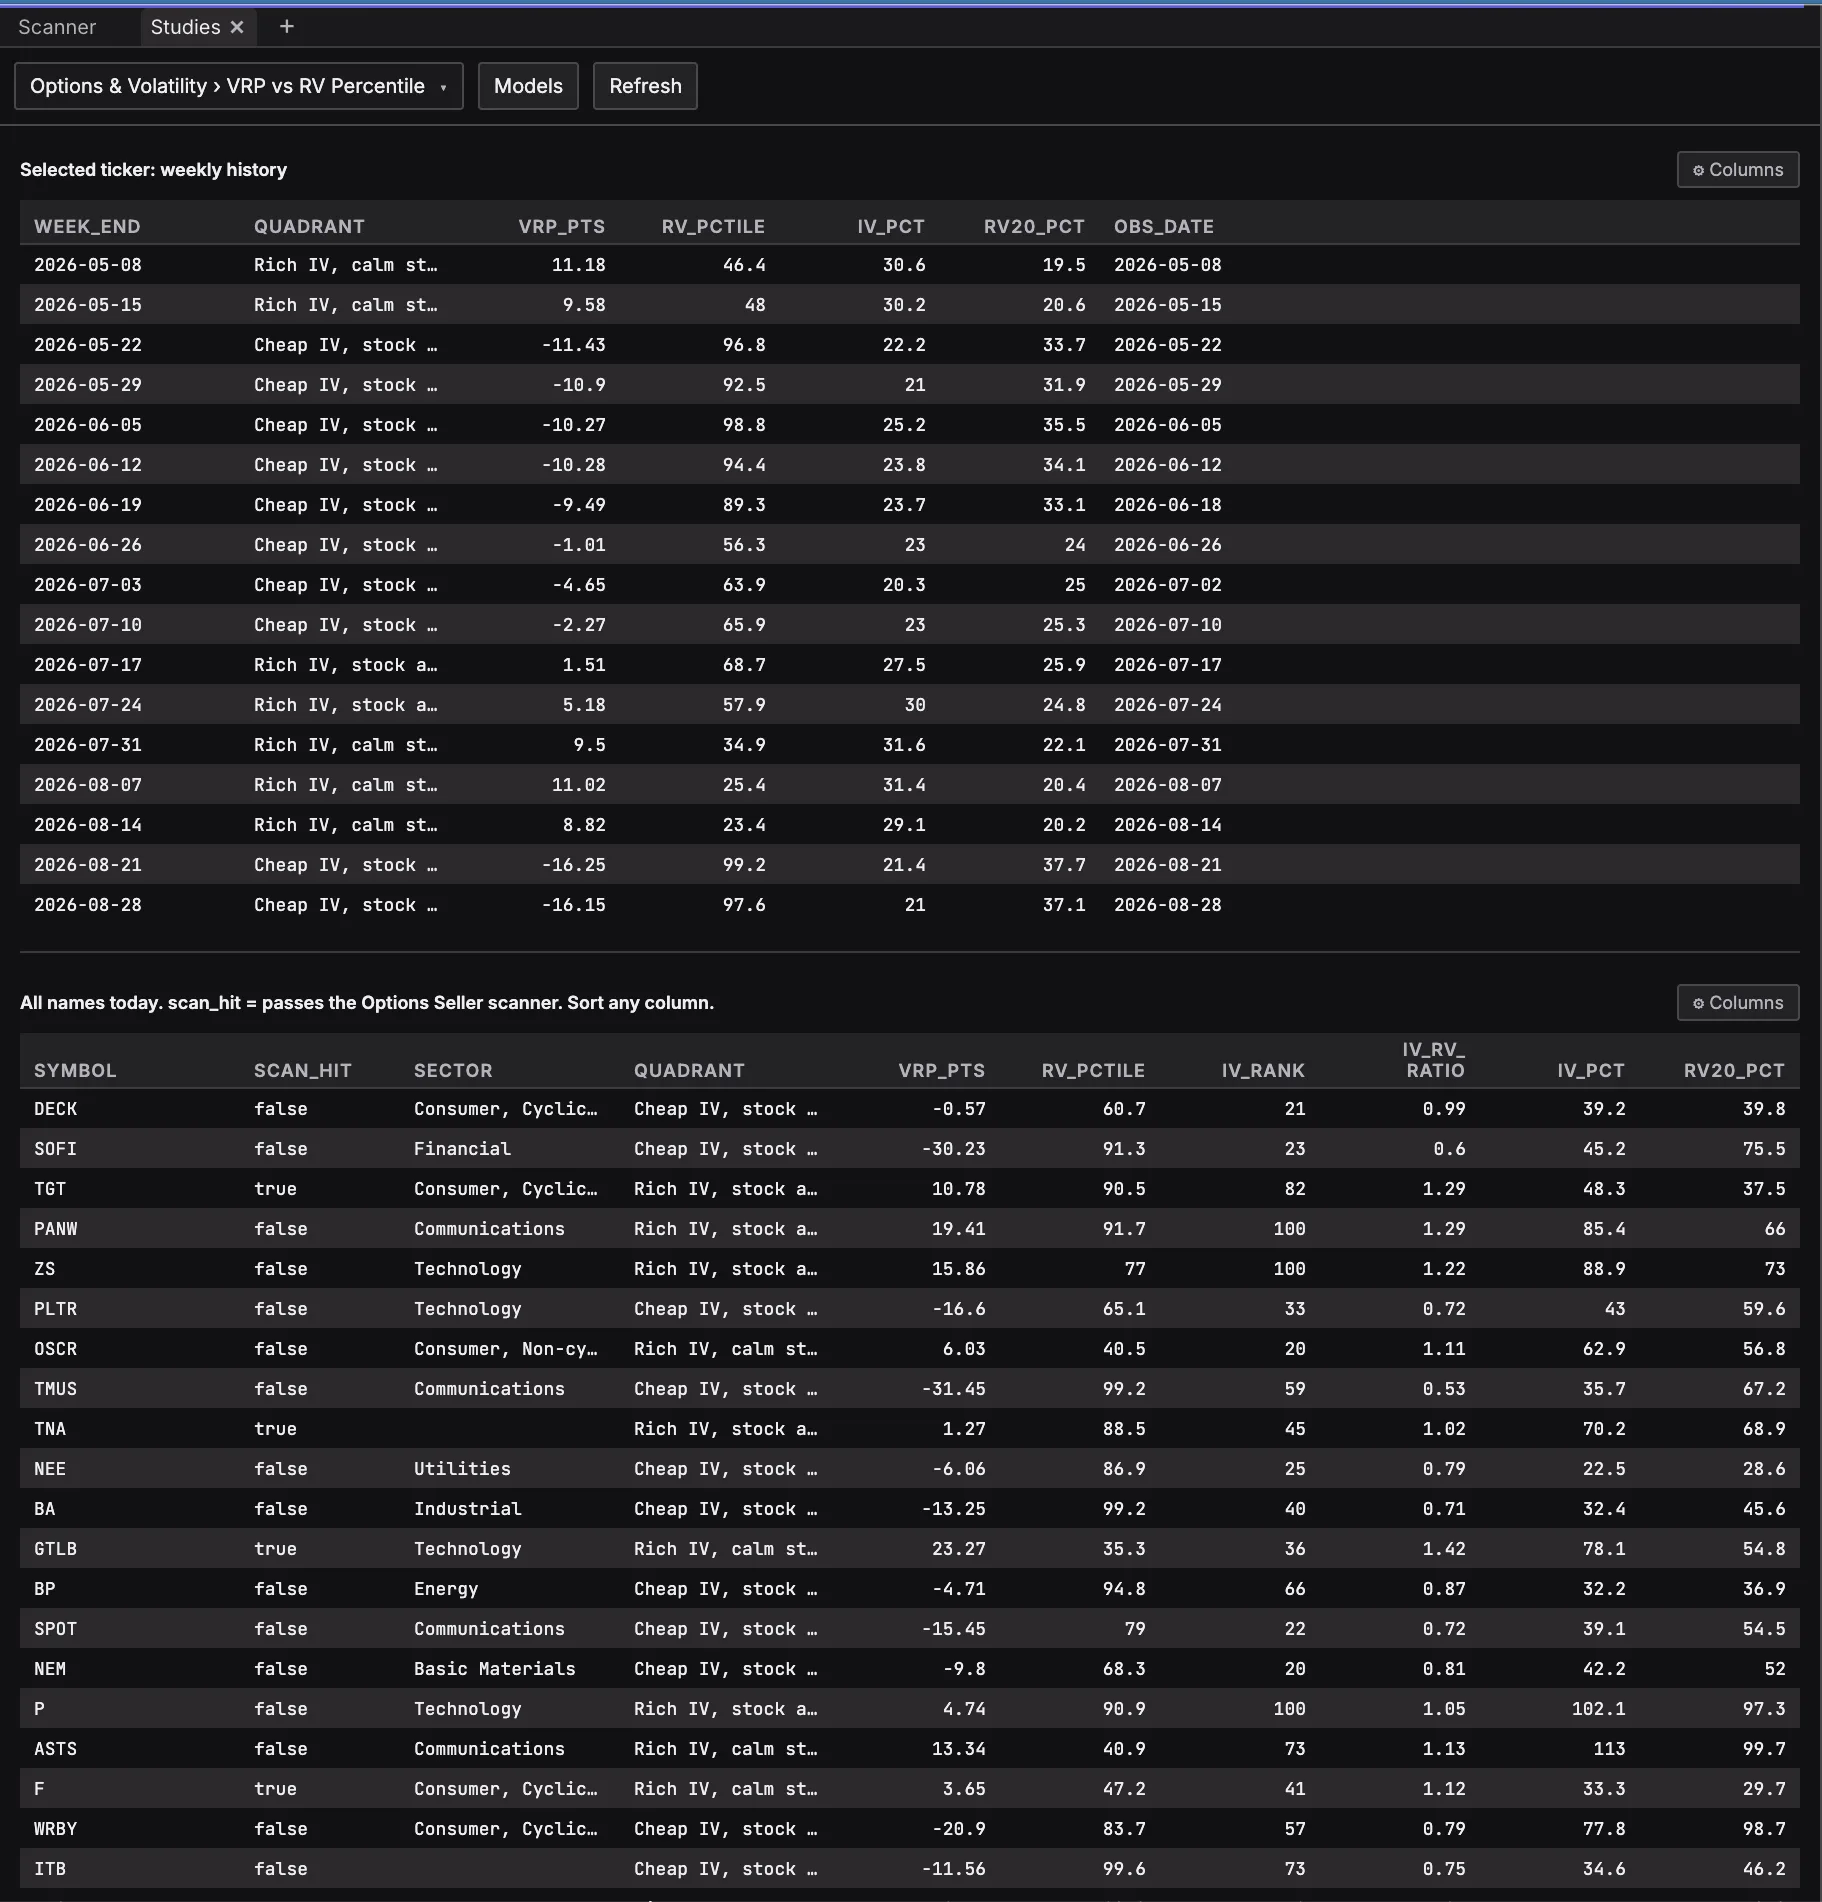
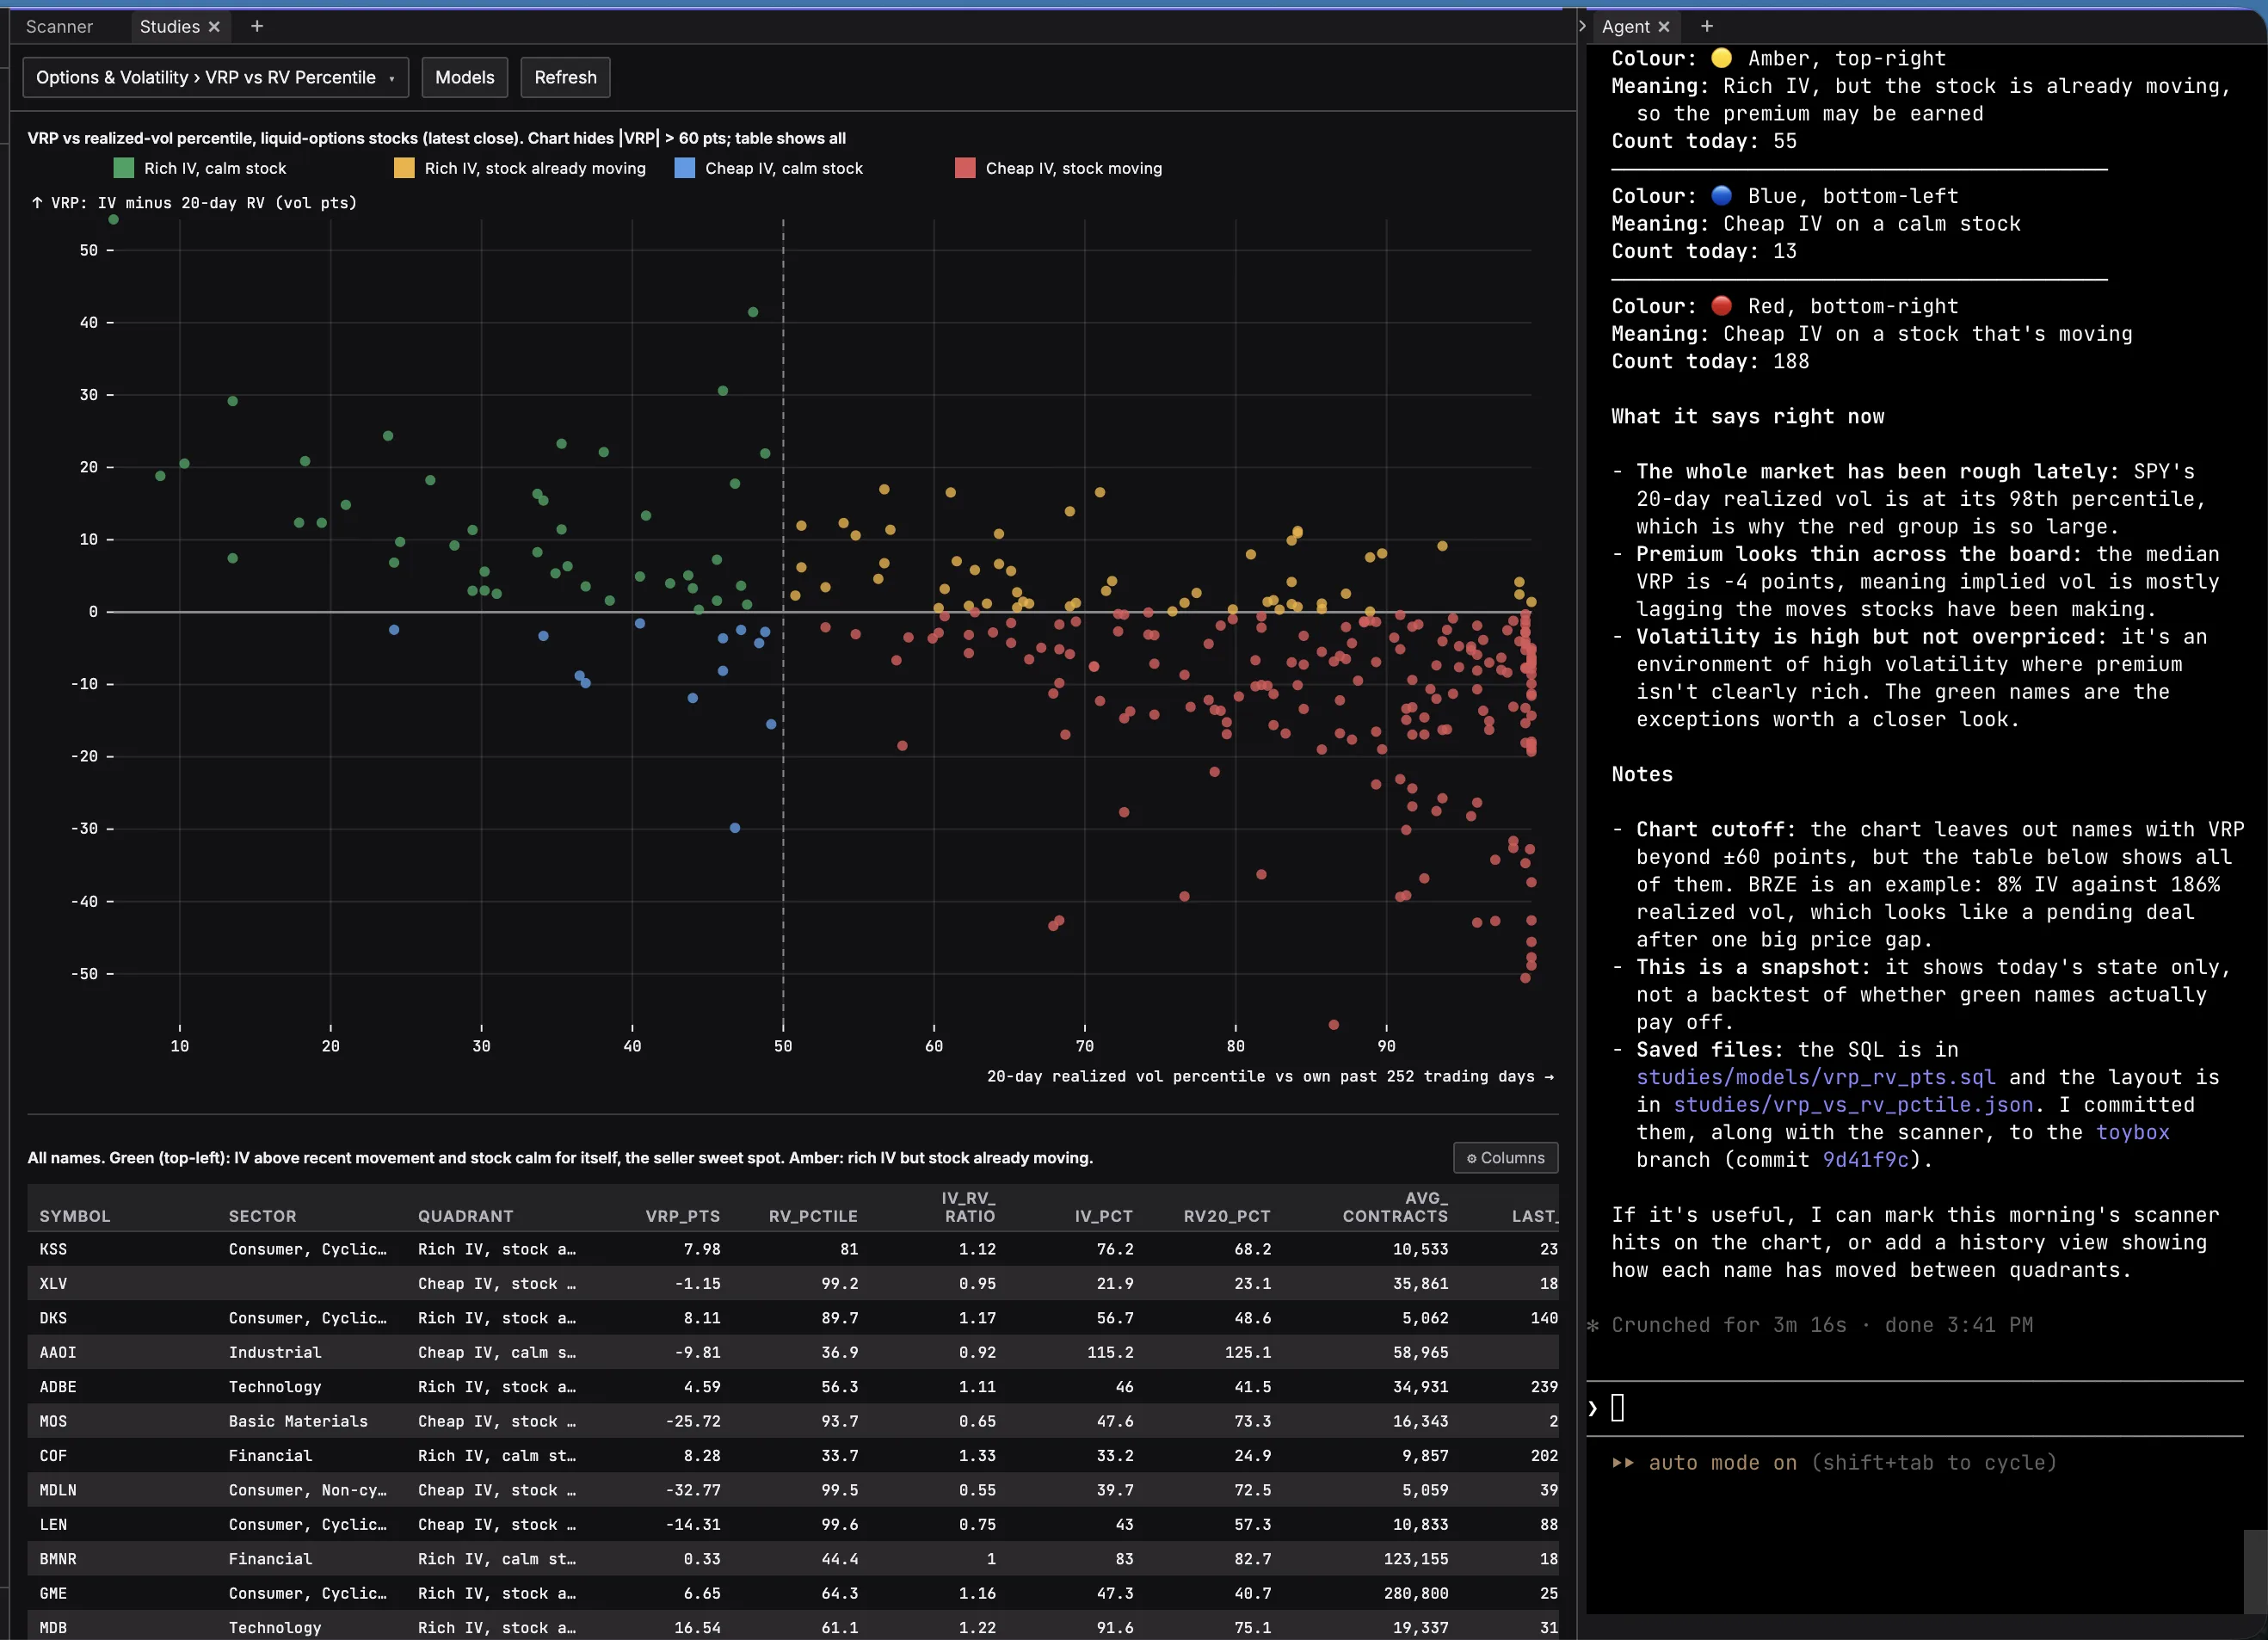
The agent writes the models and the study. The scatter plots each liquid-options stock's volatility risk premium against its realized volatility percentile, colored by quadrant, with a table of every name below.
Yes, do that. Also, the scatter needs to show the tickers, not just dots.
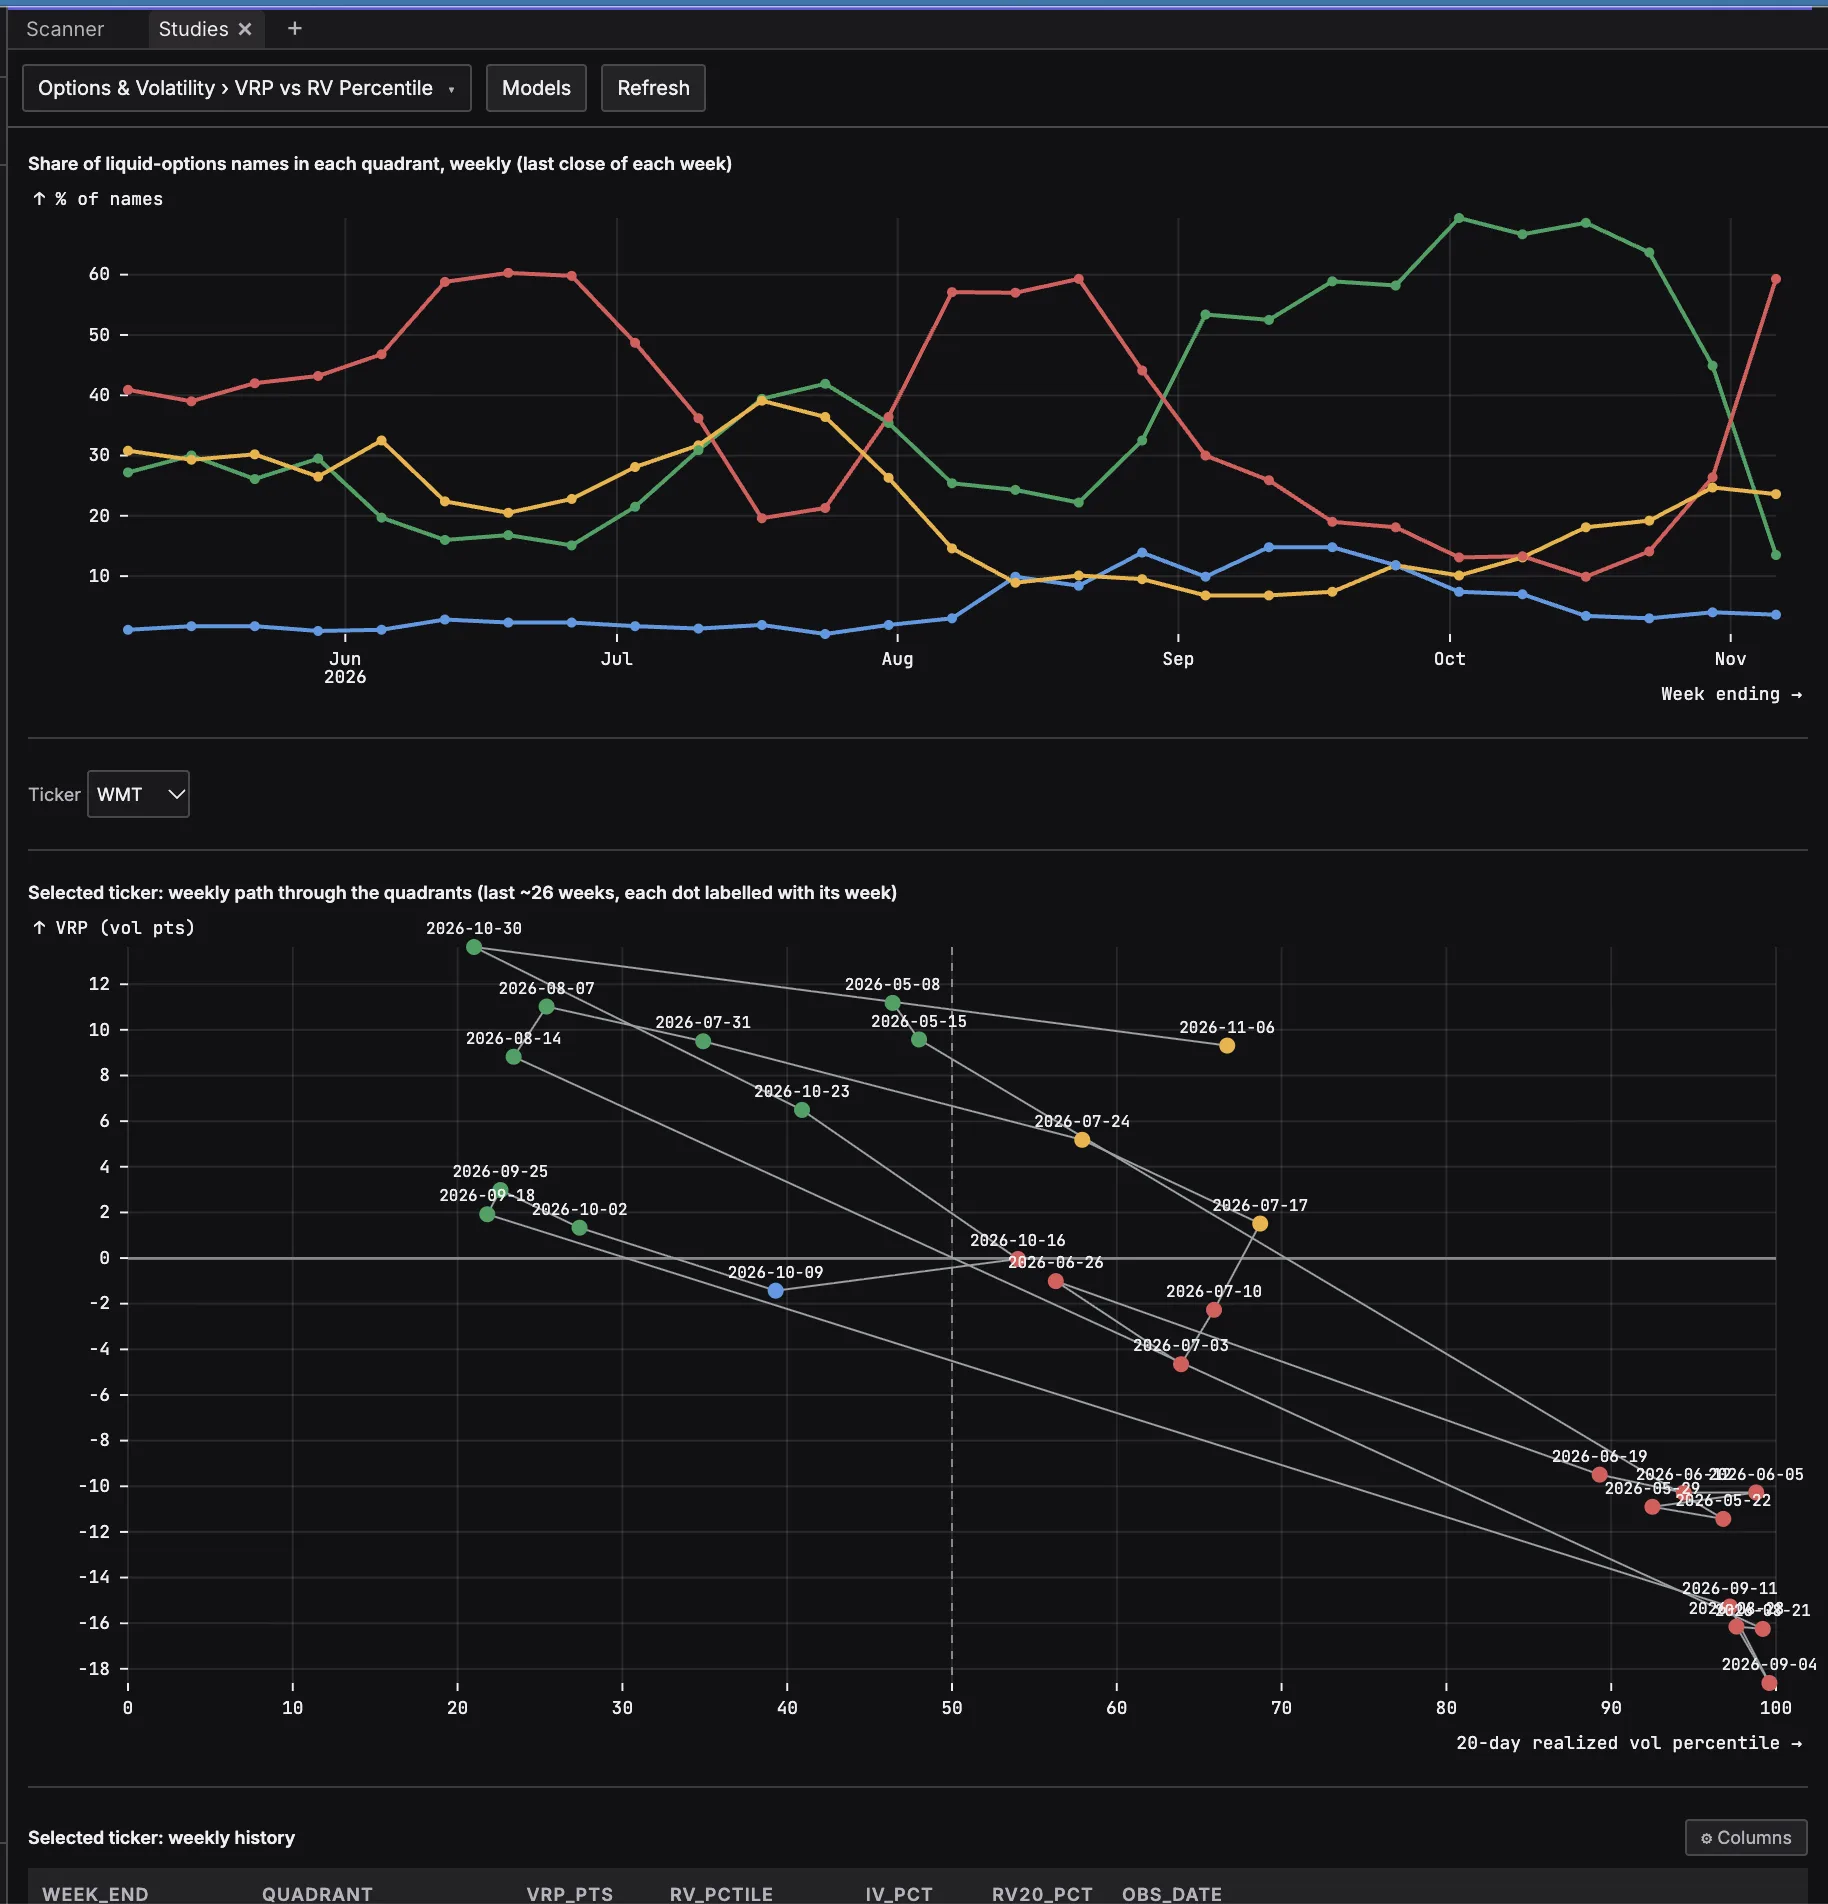
This answers the agent's offer to mark the scan's hits on the chart and add a history view. The scatter now labels every ticker and rings the stocks the scan picked. New views show the weekly share of names in each quadrant and one ticker's weekly path, selected from a dropdown.